Developing a digital interface to a ScannerMAX galvanometer controller for optical coherence tomography (OCT)
Optical coherence tomography (OCT) systems are traditionally decomposed into engine and scanner components with an expensive and noise-prone analog interface to communicate the scan pattern between the two. Although simple and convenient, analog signals are susceptible to interference and require expensive hardware to generate with appropriate precision for OCT. To overcome these limitations, we implemented a digital interface for our OCT system using low-cost embedded microprocessor and custom PC software, exploiting recent trends towards digital servo drivers for optical scanning. (Abstract for details)
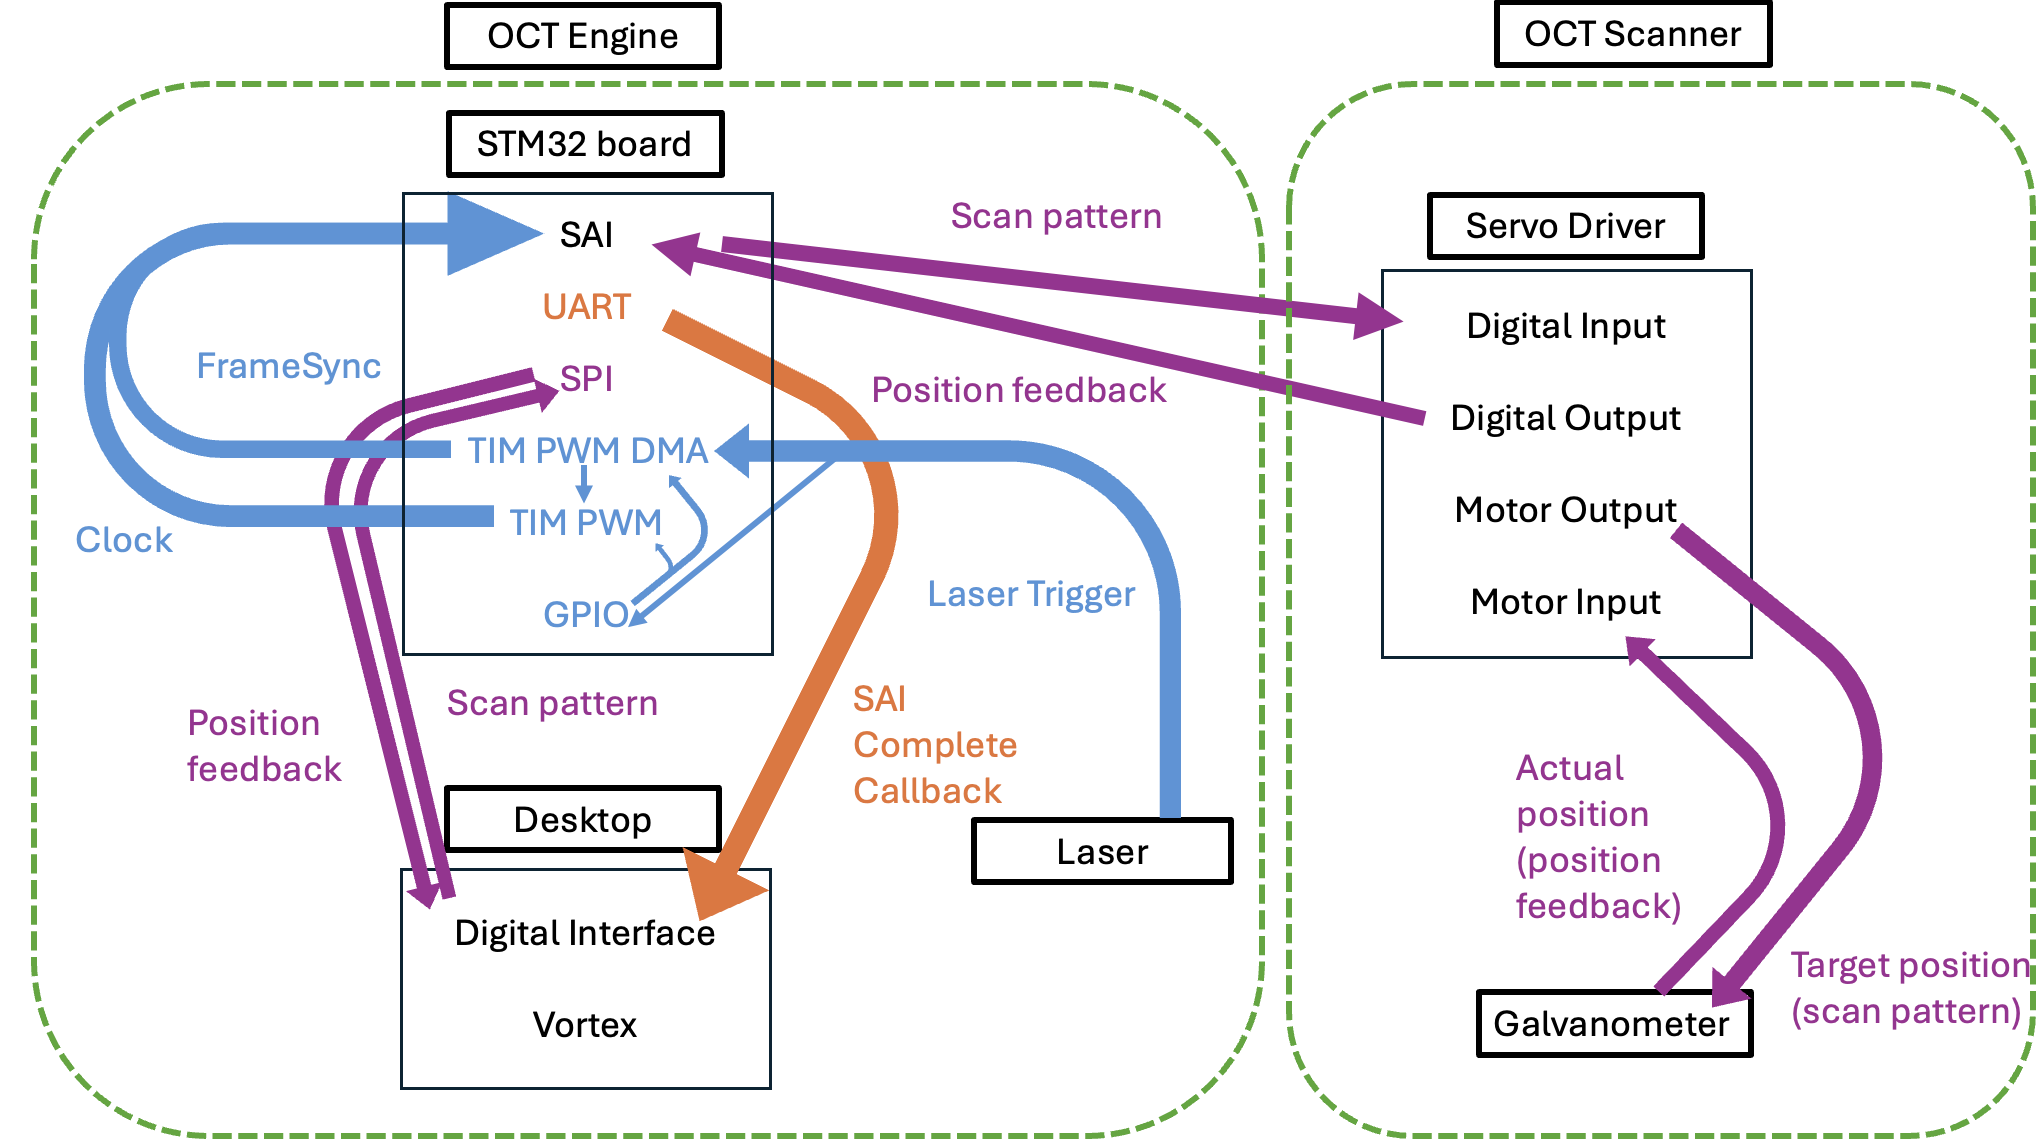
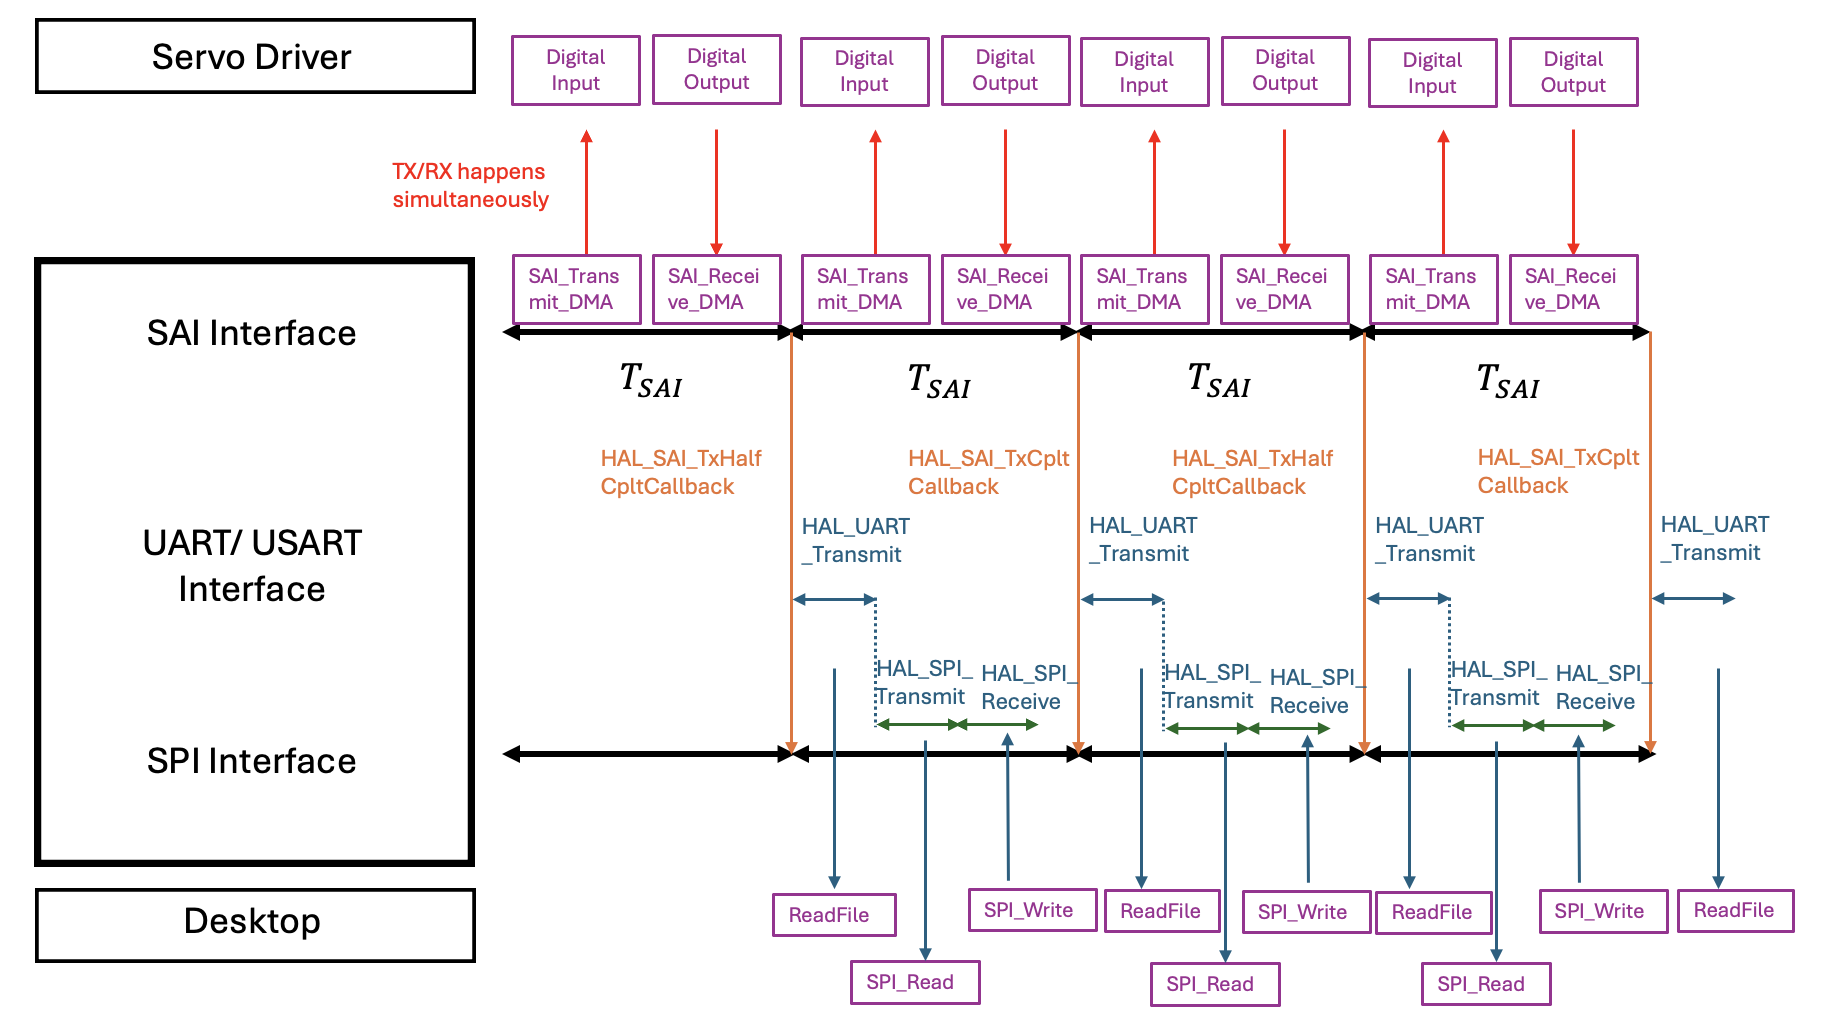
Figure 1 : Overview of the RAOCT system: Upon user initiation of the laser, a trigger signal activates the TIM Interface. This sequentially activates SAI bus, facilitating data exchange between the STM32 board and the servo driver.Figure 2 : Timing diagram of the system: Continuous exchange of scan patterns and position feedback occurs between the STM32 and the servo driver via the SAI/FB4 protocol.
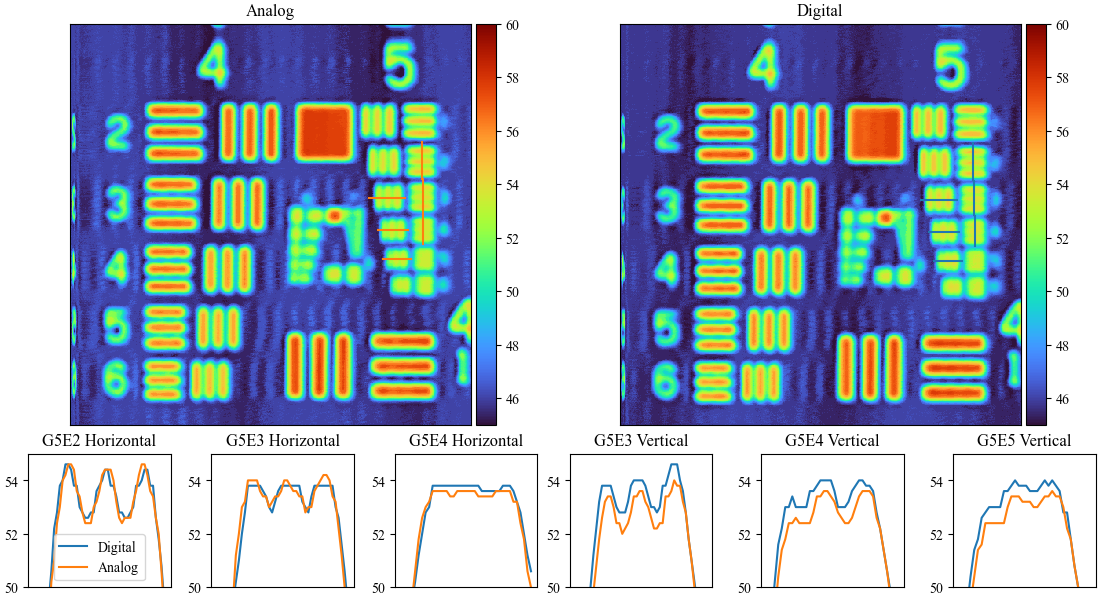
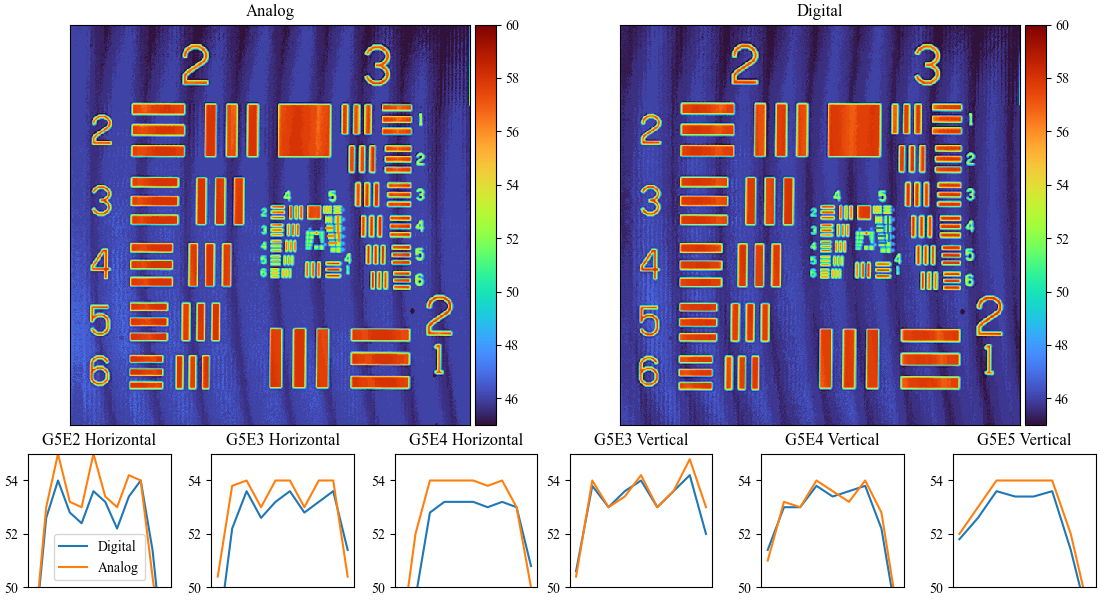
Our interface features USB interfacing with a PC for scan pattern download and position feedback upload, 50 kHz communication rate, external triggers with adjustable downsampling, and no external power requirements. We characterize the latency and noise of this digital interface and the quality of the resulting OCT images in direct comparison to a traditional analog interface that costs ten times more. Signal analysis reveals that the digital interface accurately communicated the scan pattern to the galvanometer driver and considerably reduced noise in the position feedback signal. Resolution tests show that the digital interface performs as well as the standard analog interface to the resolution limits of our OCT scanner.
Figure 3 : Comparison of analog (orange) and digital (blue) interfaces scanning groups 4 and 5 of a USAF target when amplitude of scan is 0.25 °.Figure 4: Comparison of analog (orange) and digital (blue) interfaces scanning groups 4 and 5 of a USAF target when amplitude of scan is 1.0 °
Together, these results demonstrate quantitative and qualitative equivalence of the interfaces, despite an order of magnitude reduction in cost. We plan to release open-source software, schematics, design files, and a bill of materials so that the OCT research community can benefit from these improvements and cost savings.